New laws and regulations regarding data security breaches and disclosure laws affect the way in which nearly all organizations do business in the United States. This study, by Perimeter CTO Kevin Prince, provides a review of the scope and impact of data security breaches in an effort to encourage proactive modification to risk mitigation technologies, policies, and procedures that reduce exposure to a data breach incident.
However, keep in mind that the data used to extrapolate the charts, graphs, and representations for this study is by its very nature misleading.
You may also want to check out Prince’s other slideshow on the top security threats for 2010.
Click through to learn more about the data breach trends affecting businesses in 2009.
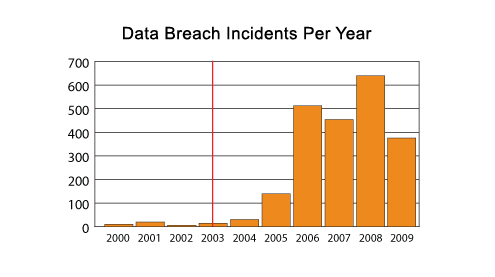
The red line indicates when California SB 1386 went into effect, the first state to adopt such legislation. It is unlikely that there were fewer data security breaches in several years prior to 2006, but rather companies weren’t required to make them public. Data breach incidents haven’t just begun to occur in the past few years, rather the requirement to disclose those events gives a first view into the nature and severity of the problem. Publicly known data breaches prior to these laws going into effect are nearly all known as a result of fraud committed using the data, or by media leaks.
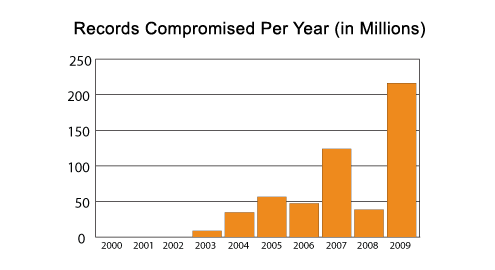
If looking only at the chart on the previous page, one would conclude that data breaches are decreasing in frequency. But there is another data point that must be analyzed in conjunction with the incidents themselves. An incident can be made up of 10 records compromised or perhaps tens of millions of records compromised.While 2008 had the greatest number of incidents reported, there were fewer records compromised than any year since 2004. Through 2008, some might conclude that hackers had to compromise more organizations to yield the same number of records. Then 2009 appears to be the opposite. While the number of incidents was the lowest reported in four years, the number of records compromised broke all previous records. Some might glean that in 2009 hackers were able to capture far more records with many fewer incidents. In other words, in 2009 hackers became much more efficient. However, remember that 2009 had the Heartland Payment Systems and National Archives and Records Administration data breaches, which together totaled more than 200 million records compromised.
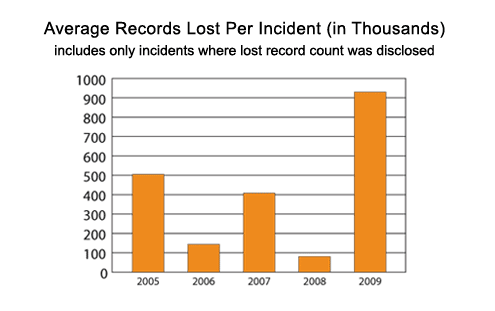
One might conclude that the number of records lost is wildly erratic from year to year, but 2009 shows a dramatic increase in the number of records lost on average with each incident.
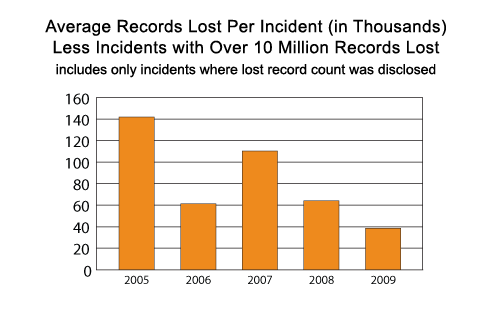
Perhaps the best way to truly analyze the trends behind lost records per incident is to remove those large incidents from the analysis. So after removing incidents where no records are reported, and also removing large data breaches where more than 10 million records were compromised, a less erratic chart seems to emerge that is very different from the previous chart. Through this data normalization process, it would appear that data breach incidents are reducing both in number and severity (in terms of records compromised).
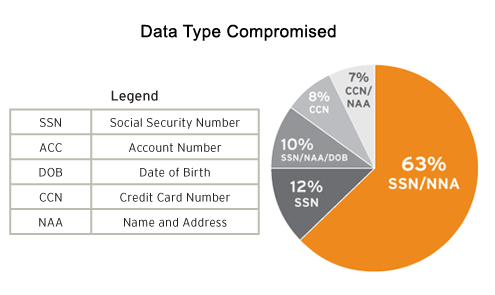
While credit card data does represent the largest single type of data that is compromised in data breaches historically, when analyzing data breaches by incident, it ranks number four on the list. The majority of data breach incidents go after much more valuable information that can lead to identity theft and fraud. Social Security numbers, name and address, and date of birth are exposed through a data breach far more often than credit card information. This information can get confusing because usually there isn’t just a single data type that is compromised (such as SSN). Usually it is a combination of data types involved in each incident.
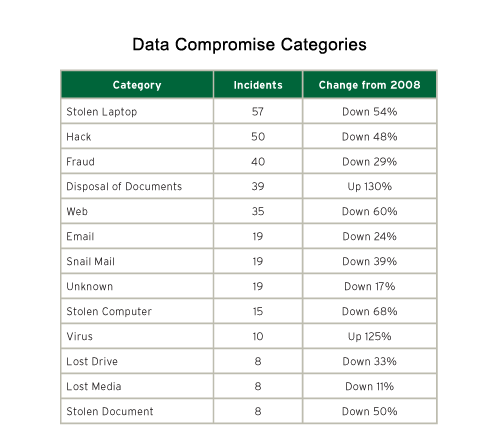
Data breaches can be classified into many categories. While 2009 had fewer data breaches overall, it is interesting to compare 2008 to 2009 in terms of incident change.
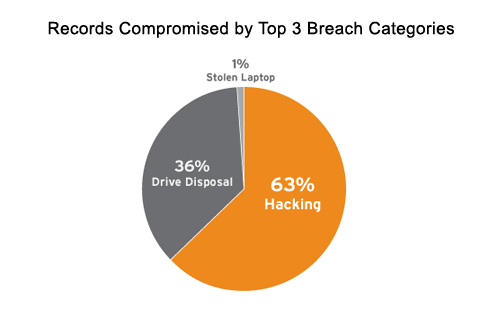
Looking at the top three breach categories by records compromised shows just how pervasive hackers have been in 2009. Hackers represent nearly two thirds of all records compromised (much of which was the Heartland data breach). Improper drive disposal accounts for the other third (which is almost entirely the single National Archives incident) and all other categories are 1 percent or less. These two categories dwarf all others due to the couple of extra-large data breach incidents in 2009.
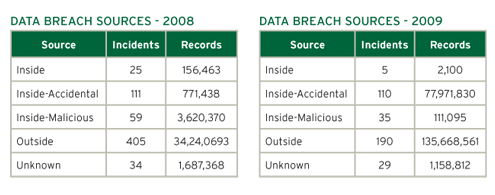
The Source of ‘Inside’ as opposed to ‘Inside-Accidental’ and ‘Inside-Malicious’ is where not enough details are available to put it into one of the other categories, or could refer to social engineering attacks where an insider is tricked into helping a malicious individual.While all other categories dropped in overall number of incidents between 2008 and 2009, the number of Insider Accidents remained nearly identical. Some industry experts attribute this to a reduction in budgetary spending for employee training as well as reduction in overall head count, both of which often lead to a greater number of mistakes.
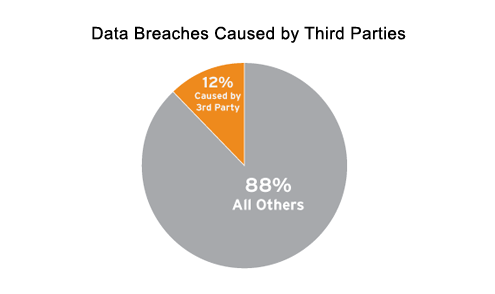
Twelve percent of data breaches in 2009 were associated with the acts of third parties. This is often a partner, vendor, or other entity that the company does business with that has access to sensitive or non-public information. While in the care of individuals employed by the third party, the data is stolen, lost, exposed, or otherwise compromised leading to the public disclosure requirement.The percentage of third-party involvement in an information security breach in 2009 has dropped. For all recorded data breaches in the U.S., 12 percent are associated with a third party being the cause.


