In theory, business intelligence (BI) applications should be able to easily visualize data regardless of where it’s located. In practice, that winds up being a lot more challenging than it should be.
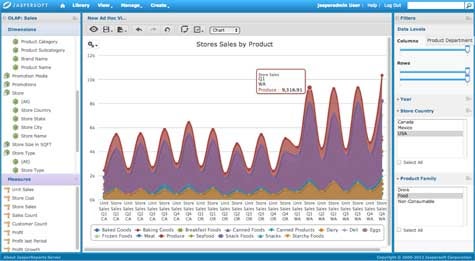
With the release today of version 5.0 of its namesake software, Jaspersoft is trying to simplify the process. The latest version of Jaspersoft not only includes a new chart engine written in HTML5 that substantially improves how data can be visualized, but it includes new data virtualization capabilities that allow users to view data from multiple sources without having to move that data into a central repository.
By and large, IT organizations are resistant to any application that requires them to extract, transform and load (ETL) data. Mike Boyarski, director of product marketing for Jaspersoft, says data virtualization doesn’t completely eliminate the need for ETL, but it sharply reduces the number of instances where it’s required. Other new Jaspersoft 5.0 features include support for a columnar in-memory engine that allows organizations to run analytics against any type of data, including a Hive interface to Hadoop, and expanded OLAP capabilities.
It’s been difficult enough to get end users to give up spreadsheets, so telling organizations they need multiple types of applications to succeed with BI only makes things more difficult. What Boyarski says customers really want is a single BI application to create an interactive reporting system spanning multiple sources of data.
There’s no doubt that when it comes to BI, simplicity is the order of the day. Organizations are already wrestling with fractured BI environments that do more harm than good in terms of promoting adoption. If IT organizations ever want user to give up their spreadsheets, then finding a way to simply visualize large amounts of data regardless of where it resides is going to be a prerequisite.


