Domo and Tableau started their data visualization and business intelligence (BI) journeys from two very different places on the IT map.
Tableau is an early pioneer of the category that got its start by enabling departments to set up their own servers to run analytics and create reports employing a patented VizQL engine invoked via a graphical user interface.
Domo, conversely, was born of the cloud. It assumes that it’s only a matter of time before all analytic applications are pushed into the cloud as the volume and variety of data that needs to be analyzed continues to increase. That approach also makes it simpler to aggregate the massive amount of data that will be required to derive value from analytics tools infused with machine learning algorithms. Just as importantly, Domo has been making a cost justification case for transitioning to its cloud platform by enabling organizations to eliminate islands of BI applications in favor of a cloud-based approach that makes it much simpler to share reports with end users anywhere in the world. Domo contends that there is no differentiated value to be provided from deploying analytics applications on-premises. In fact, one of the primary benefits of being born of the cloud is that Domo can hold more data than Tableau.
Naturally, that shift to the cloud has not been lost on Tableau, which now offers its own version of a software-as-a-service (SaaS) application in addition to providing instances of its software running on-premises and on public clouds. That approach may one day soon enable Tableau to drive a strategy spanning a true hybrid cloud. But for now, Tableau continues to be a little more flexible when it comes to deployment options. Tableau has also been moving to close the data gap by investing in a Hyper Data Engine to increase the amount of data it can process in memory.
It’s still early days as far as the battle between Domo and Tableau is concerned. After having been around for the better part of two decades, there are more Tableau users than Domo users. But as both Domo and Tableau continue to warily circle each other, a titanic struggle for control over the future of data visualization and analytics is clearly in the offing.
What are the Similarities & Differences between Domo and Tableau?
Both Domo and Tableau provide a wide variety of ways to visualize data using dashboards. Tableau has an overall edge in terms of the wider variety of pre-packaged visualizations it provides, including now geospatial analytics, that have been under development for close to two decades, compared to the more than 300 data visualization dashboards provided by Domo. Both platforms, however, are more than adequate to meet the data visualization needs of most end users.
The primary difference is the degree to which organizations want to rely on the cloud to distribute reports. Domo was developed later as a cloud-native application. However, there are plenty of organizations where storing sensitive data in the cloud is a non-starter. In those cases, Domo would not be an option.
Domo, however, also claims the number of administrators required to manage a Domo environment is substantially fewer than with Tableau, which may factor into the total cost of ownership (TCO) analysis for larger organizations. Domo also notes that it further lowers TCO because the extract, transform and load (ETL) tools required are included in the platform.
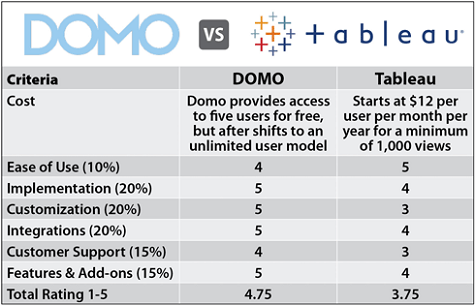
Cost
Tableau Pricing
The SaaS option for Tableau starts at $12 per user, per month on an annual basis for a single user. But there are several additional modules to address, like mobile computing requirements or the loading of data, that most enterprise organizations are going to need to license for some users.
Domo Pricing
Domo plays pricing closer to the vest. There is a free option for up to five users. But after that, Domo now offers Professional and Enterprise plans that have no limit in terms of users. The Professional plan provides access to up to 250 million rows of data, on-demand refreshes, and makes available premium support. The Enterprise plan includes all the elements of the Professional plan plus unlimited data access, along with additional security and governance control, including an instance certified to comply with the Healthcare Insurance Portability and Accountability Act (HIPAA). Each customer needs to negotiate pricing for each deal, but Domo executives estimate that the average cost for a 50-user implementation is about $83 per user per month.
Because the pricing plans are so different, organizations would be well advised to carefully consider their total costs per user once all the elements of the BI application they require are determined.
Ease of Use
Tableau User Interface
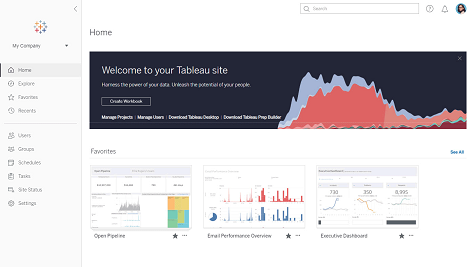
Tableau makes it simple to drill down into data without having to, for example, manually create calculations, design visualizations and format dashboards. Tableau is also investing in Ask Data natural language capabilities specifically designed for BI use cases. Overall, Tableau is accessible to almost any class of end user.
Domo User Interface
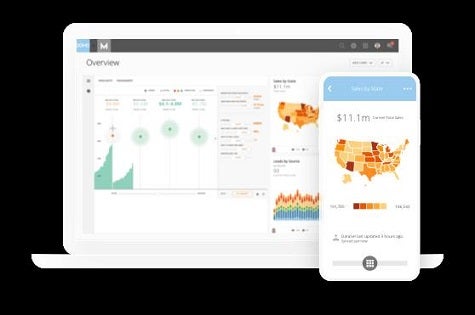
Domo, however, claims to have pursued a mobile-first approach to creating its user interface on the assumption that most of the reports would be consumed by end users employing smartphones and Apple iPads.
Implementation
As a cloud application, Domo is a little easier to set up because ETL tools needed to get data into the system are included.
Tableau is a little more challenging to set up and often requires a separate data prep tool to load large amounts of data quickly.
Customization
Tableau provides tools that enable experts to customize reports and dashboards.
Domo has gone a bit farther in not only making it possible for developers to create their own custom scripts, but also employ Domo Stories, a new feature that makes it simpler to build narratives around customized dashboard layouts.
Integrations
Both Domo and Tableau provide connectors that can be immediately deployed to access hundreds of data sources.
Domo, however, has taken advantage of its cloud strategy in creating and integrating a platform-as-a-service (iPaaS) environment around a set of open application programming interfaces to allow organizations to build their own custom connectors.
There’s also a Domo Everywhere initiative that makes it simpler for developers to embed Domo analytics within their applications.
Customer Support
Tableau offers free support via website, knowledge bases and large online communities. Domo includes support as part of its Professional and Enterprise plans. Both companies require customers to pay extra for support from them.
Features & Add-ons
In terms of data visualization capabilities, both platforms provide options for almost every user preference imaginable.
Both Domo and Tableau are, like every analytics company these days, also investing in both machine learning algorithms to automate processes as well as speech recognition interfaces to make their applications more accessible.
Tableau is beta testing an Extension Gallery that makes it simpler to discover third-party add-on tools.
Domo, however, has started rolling out add-on applications on top of its cloud platform, including a
Domo Marketing Suite aimed at marketers trying employ Big Data to better target campaigns, and Domo IoT Cloud: Domo’s IoT Cloud, which combines real-time Internet of Things (IoT) data with operational data. That latter platform is an instance of Domo cloud that comes with two applications optimized for production flows and device fleet management.
See Other Popular Business Intelligence Comparisons
How to decide which is Best for Your Situation
Much of the decision to go with Tableau versus Domo may come down to any bias an organization might have toward cloud computing. Both platforms more than adequately meet the needs of almost any users.
It is, however, worth noting, that Domo is a young company. In its most recent quarter, Domo generated total revenue of $39.4 million, an increase of 31 percent year over year. But the GAAP net loss for the quarter was $29.9 million.
In contrast, Tableau saw a 15 percent gain, to bring its revenue for the quarter to $282.5 million, while posting a GAAP operating loss of $93.2 million, which compares to a loss of $50.4 million in the same period a year ago.
The one caveat organizations need to consider carefully is the total cost of ownership of their analytics platform. Not only are there a lot of modules that need to be evaluated in terms of how many users may need access to them, it’s not too hard for an organization to find itself paying more in SaaS fees than it might for a perpetual license for an instance running on a public cloud or on-premises server.
The next major issue is then determining how much the leaders of the organization believe the provider of the analytics platform they are about to standardize on has the financial wherewithal to survive for the long haul.


