About the only thing Looker and Tableau agree on is that it is important for organizations to be able to create and share analytics. After that, the two companies diverge in not just the underlying technology they employ, but also what types of end users they are primarily trying to serve.
Looker is a cloud-based platform anchored around a proprietary markup language and database that makes it possible for average end users to launch their own SQL queries without having to know anything about SQL. LookerML is essentially a new language created specifically for analyzing data.
Tableau is a patented VizQL engine invoked via a graphical user interface (GUI) that Tableau continues to extend with support for new data types and dashboards with every release. The underlying framework relies on OLAP cubes that are familiar to most analysts.
Tableau, in contrast to Looker, gives customers the option to deploy its platform in an on-premises IT environment or in a dedicated cloud environment managed by Tableau on their behalf.
In the broadest of terms, Looker has created a platform that is intended to be accessible to almost any user from within a browser. Tableau, on the other hand, tends to be much more focused on the needs of professional analysts who need to frequently create complex visualizations that they then share across the rest of the enterprise. There are naturally analysts who can create visualizations using Looker, but the number of mere mortal business users capable of mastering Tableau are going to be much fewer and far between.
What are the Similarities & Differences between Looker and Tableau?
Looker and Tableau are both trying to make its simpler for organizations to make better fact-based decisions faster. Tableau, however, assumes that the people creating those visualizations are reasonably well versed on the principles of data science. Looker assumes the opposite. Not only does Looker assume that the average end user isn’t even sure how best to represent the data being analyzed, the platform assumes the average end user doesn’t even know how to create and launch a simple SQL query.
There’s no doubt that Tableau can create a much broader array of complex visualizations across multiple data types using a drag-and-drop graphical user interface (GUI). However, both platforms are more than capable of meeting the needs of most business users. Tableau also provides a wide variety of pre-packaged visualizations that reduces the amount of effort analysts need to make when trying to identify what type of chart lends itself best to a specific data set. Tableau also makes it simple to drag and drop those visualizations into other applications, including Microsoft Office 365 or Salesforce customer relationship management (CRM) software.
Looker, on the other hand, is not only focused on making it simpler for the average end user to create visualizations, it also provides a deep set of software development kits and application programming interfaces (APIs) that make it possible to infuse analytics deeper into workflows and business processes in near real time. Looker also makes available Looker Actions, a set of integration capabilities that make it possible to update data residing in third-party applications.
As a cloud service based on a traditional database, Looker is going to scale higher than Tableau, in addition to being able to consistently ensure that governance rules are applied across a common pool of data. Looker also employs a lightweight virtual data model that allows analytics to be run on a local database and then presenting the end user with the aggregated results versus requiring all data to be loaded into Looker.
In many ways, Looker is trying to solve a more challenging set of analytics-infused data management issues.
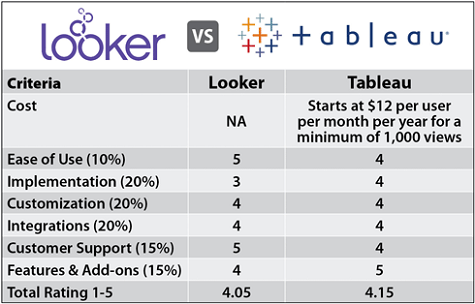
Cost
The SaaS option for Tableau starts at $12 per user per month on an annual basis for a single user to view data. There are, however, several additional modules to address, for example, mobile computing requirements or the prepping of data, that most enterprise organizations are going to need to license for some users.
Tableau provides customers with Creator, Explorer and Viewer. Prices are listed per user, per month, billed annually. The Creator plan includes full functionality of Tableau, and costs $70 per user, per month, regardless of whether the platform is deployed on-premise or in the cloud. The Explorer plan targets users who want self-service analytics without the data prepping and cleaning. It costs $35 per user, per month for on-premises deployment, and $42 per user, per month if deployed in the cloud.
Looker, in contrast, is a lot cagier about pricing. It prefers to negotiate each customer engagement based on not just the number of users per month, but also the complexity of the semantic layer that needs to be created for each individual customer.
Ease of Use
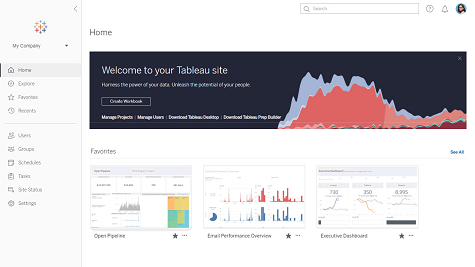
Tableau makes it simple to drill down into data without having to, for example, manually create calculations, design visualizations and format dashboards. Tableau is also investing in Ask Data natural language capabilities specifically designed for BI use cases. Overall, Tableau is accessible to almost any class of analyst in one form or another.
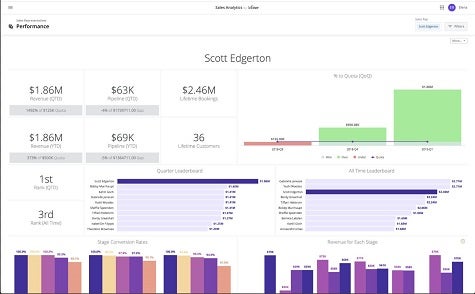
Overall, however, Looker is easier for the average business user to master once it is set up. The degree to which professional analysts might find Looker robust enough to meet their demands is likely to vary widely.
Looker User Interface
Tableau User Interface
Implementation
Given its longer focus on departmental use cases, Tableau, with some help from IT, is easier for most departments to set up. Tableau also offers Tableau Public, a free service that an end user can employ to visualize, for example, a single instance of a Microsoft Excel spreadsheet.
Looker may be simple to use, but all that simplicity is derived from the setting up of a custom semantic layer on the company’s core platform that can take a considerable amount of time to create.
Customization
Tableau provides tools that enable experts to customize reports and dashboards. Tableau also makes available an Extensions API for its dashboards.
Looker takes a different approach by employing Looker ML to break SQL down into bite-sized chunks that are easy to examine, digest and recombine. That approach can then be used to extend those chunks of SQL directly into business logic.
Integrations
Tableau provides more than 65 native connectors that can be used to access more than 40 data sources.
In addition to Looker Actions and its SDKs, Looker makes available connections to Google BigQuery ML and the TensorFlow framework that is being widely relied on to build artificial intelligence (AI) applications. Looker also integrates seamlessly with GitHub or your own Git server within the context of a DevOps environment.
Customer Support
Tableau offers free support via website, knowledge bases and a large online community. Tableau also provides several tiers of paid support.
Looker also provides support as part of its license; in addition, it includes the ability to contact support via chat or email directly from within its product.
Features & Add-ons
In terms of data visualization capabilities, both platforms provide a wide variety of options. Tableau provides access to a deeper set of visualizations and associated “story telling” tools. Tableau is also beta testing an Extension Gallery that makes it simpler to discover third-party add-on tools. Given its larger installed base, Tableau right now has attracted a larger pool of third-party developers to its platform.
Looker, however, as of late, has been adding full-blown applications aimed at specific roles within an organization, including offerings aimed specifically at digital marketers and web site managers and a beta release of an application aimed at sales teams.
See Other Popular Business Intelligence Comparisons
How to decide which is Best for Your Situation
Although Tableau has come a long way from its days when it was perceived to be mainly a departmental analytics application, there are still some shortcomings in terms of the suitability of the platform for being employed at scale within an enterprise.
Nevertheless, Tableau continues to gain momentum. The company saw a 15 percent gain to bring its revenue for the quarter to $282.5 million, while posting a GAAP operating loss of $93.2 million, which compares to a loss of $50.4 million in the same period a year ago. Despite those losses, however, organizations should also factor the number of analysts that might already know how to take full advantage of Tableau into their decision making.
Looker is a privately held company that thus far has raised over $280 million in funding since 2013. As of the end of 2018, Looker claims its revenues grew 70 percent year-over-year, while adding almost 500 new customers, including Cisco, ESPN, Marks and Spencer Plc, Trivago, Adyen, Live Nation Entertainment, Bell Media, SunRun, Inc. and Five Guys. Looker also claims more than 185,000 people at over 1,600 companies around the world combine to use Looker for more than 67 million minutes each month.
The decision to go with Looker versus Tableau, however, may simply come down to not just the type of end users who need to be served, but also the degree to which analytics needs to be infused across multiple business processes.


